


In 2023, drought spread across dozens of departments in France, arriving in each with broadly similar severity. A large independent study covering more than 1,200 French farms and over 330,000 hectares found that farms following the most regenerative practices lost around 8% of their yield to that drought, while the least regenerative farms in the same regions lost 22%, a gap that persisted once differences in soil type were accounted for.[1] The hazard reaching each farm was much the same. The difference in outcome came from the condition of the soil holding it.
What risk is actually made of
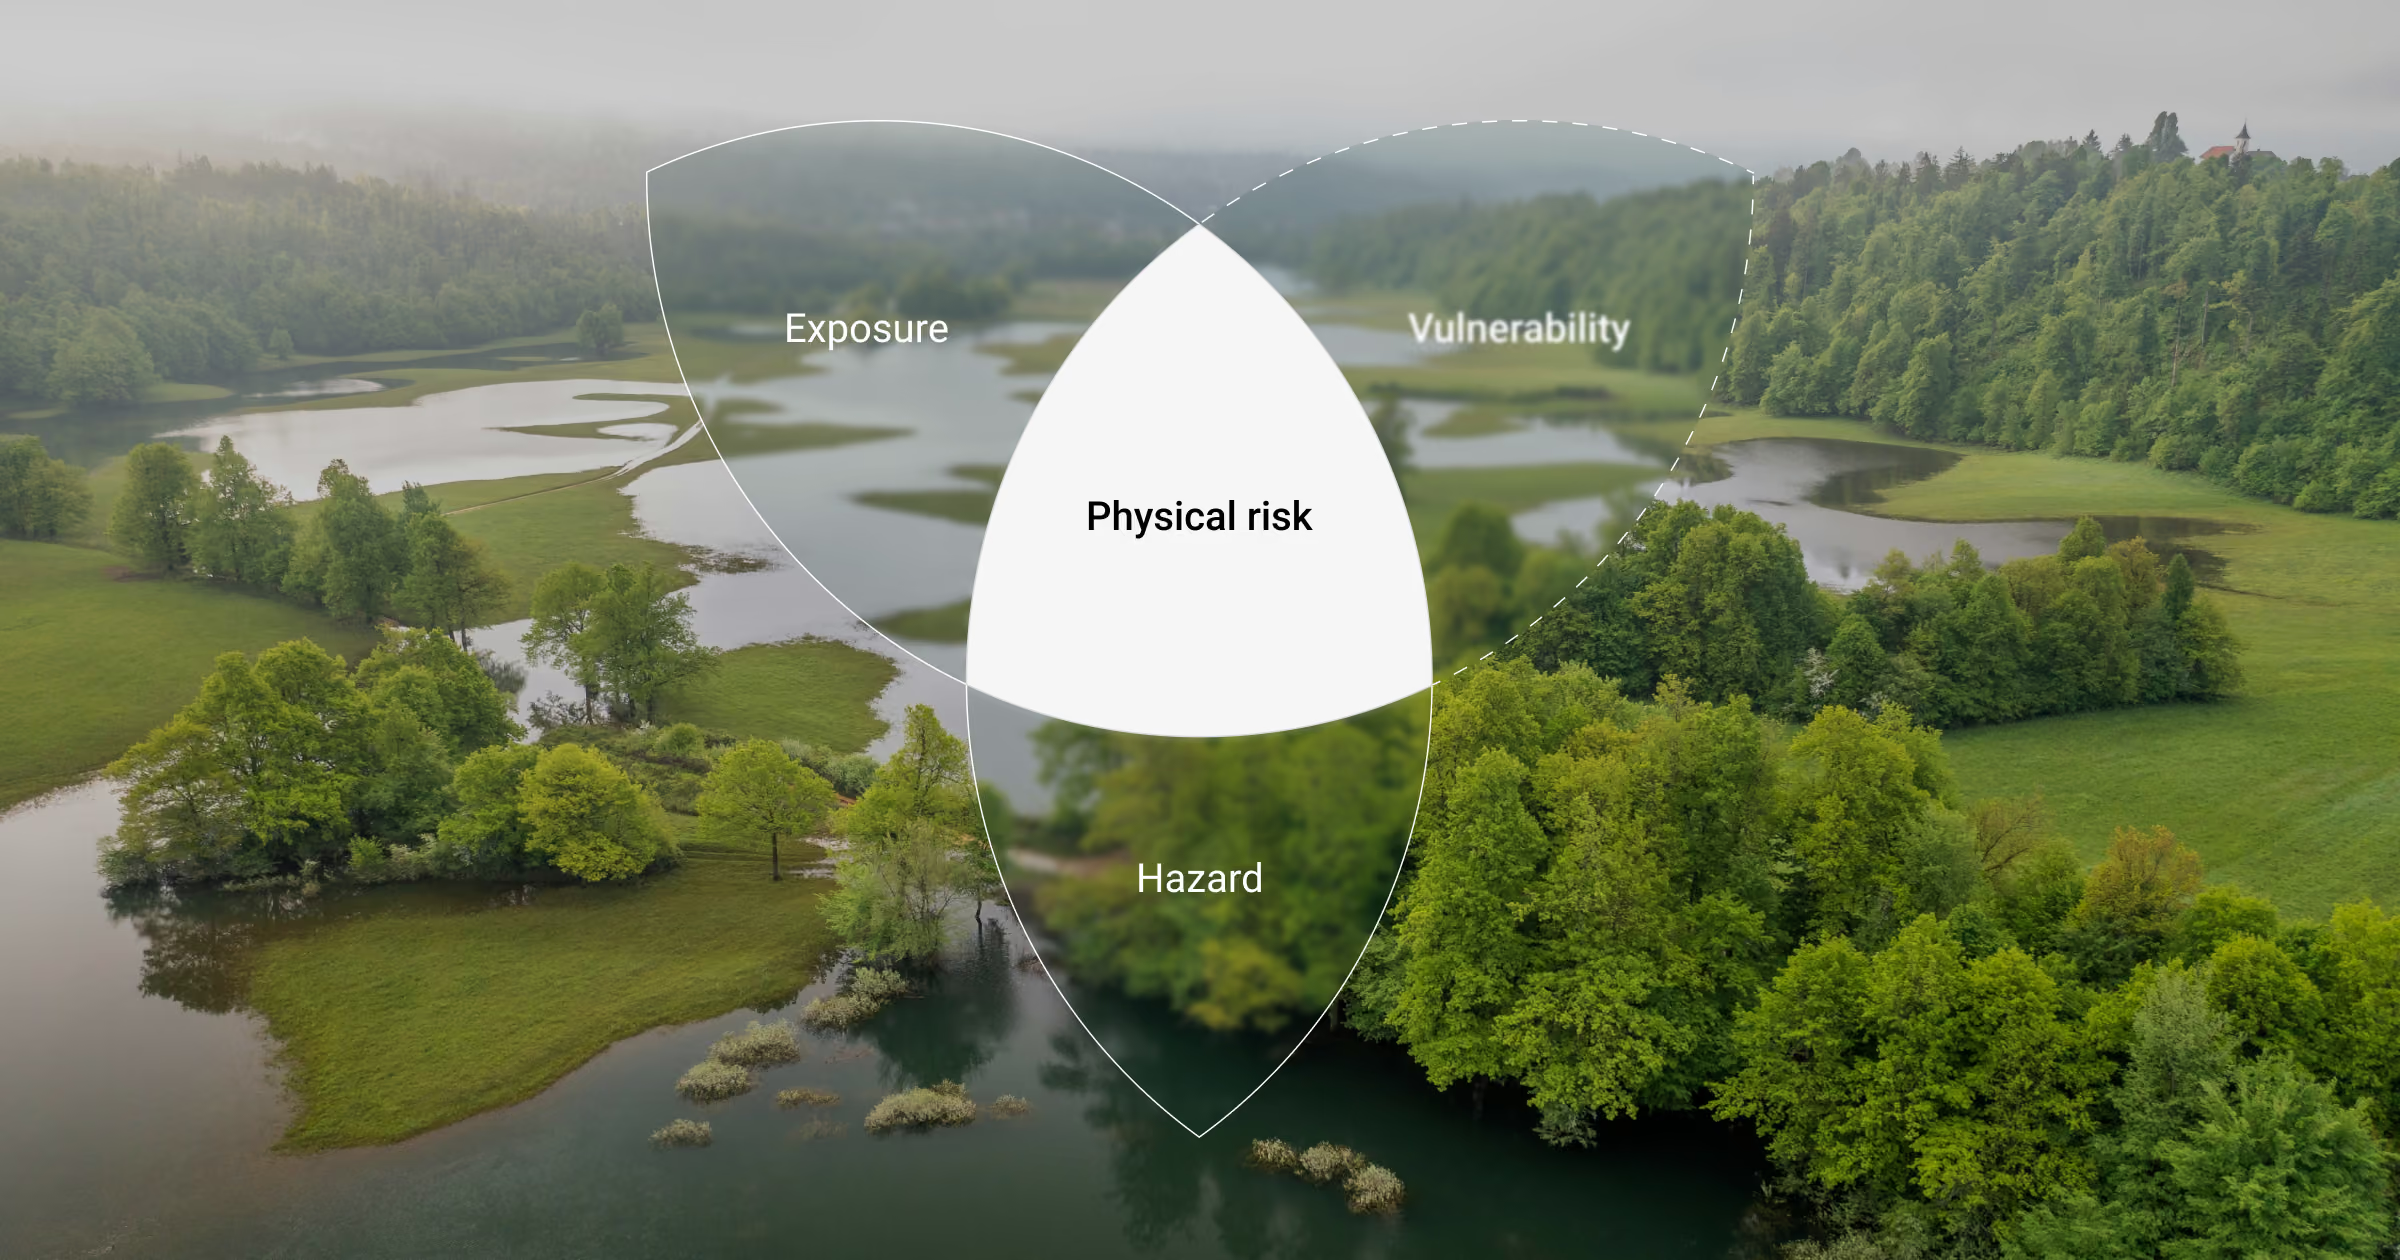
Risk from an event like this is usually described as a function of two things: the hazard itself, and exposure, meaning whether an asset or activity sits in its path. Climate and disaster risk research adds a third component, vulnerability, defined as the propensity of a system to be adversely affected by a hazard.[2] That propensity has two parts: its sensitivity, meaning how directly it is affected once stress arrives, and its adaptive capacity, meaning its ability to absorb or recover from that stress.
Healthy soil holds water and buffers a farm against a dry season; degraded soil does not, so the same drought reaches the farm with more force. A watershed with functioning wetlands absorbs and regulates a flood, reducing its extent and severity before it reaches the assets downstream; a watershed that has been drained and built over does far less of this, so more of the same rainfall arrives as damage rather than being buffered away. Of course, ecosystem condition is not the only thing that drives vulnerability: income levels and the financial buffer available at the point of impact, engineered defences such as levees and drainage systems, and the availability of insurance all shape how much of a given hazard an asset ultimately absorbs. It is, however, the ecosystem-condition, that is most consistently missing from the data available to lenders, investors, and insurers today.
Dependency is a separate, fourth component, and it belongs to the business rather than to the landscape. It measures how reliant a business's operations are on a given ecosystem service: the severity of the functional and financial consequences it would face if that service were disrupted.[3] A farm depends directly on soil, water, and pollination, so a disruption to any of them reaches its income statement quickly. A software company operating from an office in the same region depends on ecosystem services too, indirectly, through the food, energy, and materials supply chains that support its staff and premises, but the link is far more diffuse, and a disruption takes much longer, and far less directly, to register as a financial consequence. Two businesses can occupy identical land, face an identical hazard, and sit within an ecosystem of identical vulnerability, and still carry different financial risk, because how reliant each one is on what that ecosystem provides is not the same.
Of these four components, hazard and exposure are the ones markets have made the most progress on. Catastrophe models and geospatial exposure data increasingly tell an insurer or a lender whether a given asset sits inside a flood plain, a heat corridor, or a wildfire zone, and climate-related hazards are, to a growing extent, priced accordingly. Other hazards, such as pollinator loss or falling water tables, are earlier in that process and are priced far less consistently. Vulnerability and dependency are earlier still: for the most part, neither the condition of the ecosystem an asset relies on, nor the financial impact of losing ecosystem services, appears in mainstream equity valuation, credit assessment, or insurance pricing. A business's financial risk is currently assessed largely on whether a hazard exists, not on how much that hazard would actually cost given the condition of the land its operations depend on.
The evidence gap is real
Two pieces of research show what happens where this gap plays out at scale.
Bloomberg, drawing on physical risk data from Riskthinking.AI linked to company-level cost of capital, found that a 10 percentage point increase in a firm's modelled asset damage rate is associated with a 22 basis point increase in its weighted average cost of capital, after controlling for sector, size, and region.[4] The effect is not uniform: it is stronger in asset-intensive sectors such as materials (56 basis points) and utilities (45 basis points), and in emerging-market regions such as Latin America (94 basis points) and Asia (25 basis points). This shows that markets do price physical risk once it becomes visible and attachable to a specific asset. It is, however, a study built on damage to physical assets rather than on the condition of the ecosystems around them, so it speaks to the hazard-and-exposure part of the picture rather than vulnerability or dependency.
A separate study constructed nature-dependence scores for more than 30,000 listed firms across 117 countries, based on how reliant each firm's revenue is on ecosystem services such as water regulation or pollination.[5] The researchers found that firms with a high reliance on a small number of critical ecosystem services, particularly water-related ones, carry measurably higher downside risk than firms with a lower or more diversified reliance. The size of the effect is modest in absolute terms, a one standard deviation increase in this measure was associated with roughly a 3 basis point rise in value-at-risk, but it was concentrated and statistically distinguishable rather than diffuse: it is not that nature dependence raises risk a little everywhere, it is that a small number of critical dependencies raise it meaningfully wherever they exist. Two further findings are worth noting. This dependence showed no relationship to what companies report in their sustainability disclosures, meaning the risk is currently invisible to the channels investors would normally use to find it, and it was unrelated to firms' exposure to physical climate risk, meaning it is capturing something distinct from the hazard-and-exposure effect described above.
Why this matters
This absence has three distinct consequences.
Markets are beginning to price hazards, though it is not clear that this is yet complete or consistent across sectors and regions. Dependency is also starting to receive attention, but largely from a materiality and disclosure standpoint, rather than as something that feeds into what it costs that company to borrow or raise equity. Vulnerability, and the chain connecting ecosystem condition to financial outcomes, remains unpriced. Two businesses with identical hazard exposure are, in practice, treated largely the same.
As a result, resilience goes unrewarded. Where there is no way to measure how much an asset's vulnerability or dependency has been reduced, whether through soil restoration, watershed management, there is also no way to price that improvement differently from a business that has done nothing. The market cannot currently distinguish preparation from neglect.
This has a specific practical consequence for lenders and investors whose physical risk assessment is currently limited to hazard and exposure: such an assessment can only ever justify raising a client's cost of capital when a hazard is identified and never lowering it in response to demonstrated resilience. This creates a difficult position with clients who have invested in reducing their vulnerability and reasonably expect that investment to be reflected in their terms, with no current mechanism available to demonstrate that it should be.
The third is that repricing, once it happens, tends to be abrupt rather than gradual, and it lands on an entire category of assets rather than distinguishing within it. In 2023, State Farm, then covering close to a fifth of California's homeowners insurance market, stopped issuing new home insurance policies in the state, citing wildfire losses, rebuilding costs, and rising reinsurance costs; several other large insurers followed with restrictions of their own.[6] The exit was not a graduated repricing of the specific properties most at risk. It was a wholesale withdrawal by some of the market's largest participants, applied to an entire state at once. This is closer to the shape repricing tends to take once a risk has been building unseen for years: not a smooth adjustment to the cost of capital, but an exit.
There is a further, more conceptual problem with how markets treat a risk of this kind. Standard financial theory, following the distinction Frank Knight drew between quantifiable risk and unquantifiable uncertainty, suggests that a real risk which cannot yet be measured with precision should carry a higher price, not a lower one: facing genuine ambiguity about a future outcome is generally thought to warrant compensation, not a discount.[7] In practice, the treatment of vulnerability and dependency runs the other way. Because neither has a standardised data feed to populate a line in a cash-flow model or a component of a discount rate, both tend to be assigned something close to an implicit weight of zero. A measurement gap that should, in theory, widen the risk premium instead narrows it toward nothing, and the absence is read by the market as an absence of risk, rather than as a risk that has simply not yet been quantified.
Why this is hard to fix
If the fix were straightforward, a version of it would likely already exist. Vulnerability and dependency are difficult to price for reasons that are structural rather than a simple absence of will.
Vulnerability is highly local. Soil condition, water tables, and land use can vary meaningfully between neighbouring fields, let alone between regions, so capturing an ecosystem's sensitivity and adaptive capacity at a scale useful for pricing means working with a level of spatial detail that most datasets, built for national or regional reporting, were not designed to hold.
Dependency presents a different kind of difficulty. Establishing that a business relies on a given ecosystem service is possible in principle. Establishing how severely its operations would be affected if that service were disrupted, and at what point a partial disruption becomes a threshold the business cannot operate past, is a harder, more business-specific question, and one that has to be answered separately for each activity rather than read from a general sector average.
The distance between what happens on the ground and what shows up in a financial model is also long, and every link in that chain currently has gaps. A change in land management, cover cropping, wetland restoration, reduced tillage, produces an ecological outcome, such as higher soil organic matter or a restored floodplain. That ecological outcome changes the underlying vulnerability of the system: its sensitivity and adaptive capacity to a given hazard. Changed vulnerability alters the risk profile of any asset or activity that depends on the services that ecosystem provides. That risk profile then needs to be translated into something a financial model can use, such as a damage curve showing expected loss at a given hazard intensity, which in turn, in a credit model, feeds into inputs like probability of default, loss given default, or, in an equity model, a discount rate adjustment. Data and methodology exist for parts of this chain individually. Comparatively little exists to connect them end to end, which is consistent with findings that lenders and investors working on physical risk continue to report significant gaps in the asset-level information needed to move from a hazard map to a firm-specific price.[8]
A further limitation sits on top of this chain: most physical risk assessment is still built around a single hazard, evaluated at a single point in time. A portfolio review typically asks whether a given asset sits in a flood zone, or whether a region is projected to face heat stress by 2050. That answers whether a risk exists in isolation. It does not answer what happens when a heatwave and a drought land on the same asset within the same underwriting year, a pairing increasingly documented as a compound climate hazard rather than two independent events.[9] Reinsurers have begun documenting the broader pattern directly: 2024 alone produced an estimated $320 billion in global natural catastrophe losses, and the assumption that different hazard types diversify away within a portfolio has increasingly not held up against the loss data.[10] Underwriting and credit models remain built largely around single-hazard coverage, even as compounding, cascading, and repeating impacts account for a growing share of realised losses.[11]
The scale at which vulnerability needs to be measured also depends on the hazard in question, which limits how far a single dataset or methodology can travel across hazard types. If heat stress is the primary hazard facing a farm, the relevant unit of analysis is the field and a buffer around it, since local vegetation cover and microclimate regulation are what determine how much of that heat reaches the crop. If flooding is the primary hazard, the relevant unit is the watershed, since it is upstream land use, wetland extent, and drainage patterns that determine whether the same rainfall arrives as a manageable event or a damaging one. There is no single spatial resolution that serves every hazard, so a vulnerability assessment built for one hazard cannot simply be reused for another.
Finally, pricing any of this requires knowing precisely where an asset sits, and that location data is often the hardest piece of information to obtain. Assessing a hazard at the level of a client's overall business is difficult enough without granular data. Assessing vulnerability at the level of a specific asset or transaction is harder still, since it requires knowing not just a region or postcode, but the specific watershed, field, or landscape unit the asset depends on, information that is frequently unavailable to the lenders and investors who would need it most.
A further challenge sits outside the measurement problem entirely, though it follows directly from it. Even where vulnerability can be measured, the benefit of reducing it, through soil restoration, watershed management, or similar investment, often does not show up for several years after the work is done, while a loan, lease, or investment relationship is typically priced and reviewed on a much shorter cycle. This is not a difficulty in quantifying vulnerability itself. It is a difficulty in using that measurement well: deciding how a lender or investor should treat a client partway through a multi-year resilience investment, when the pricing relationship may conclude before the benefit is fully realised.
A related challenge is that pricing vulnerability once is not enough. Understanding whether a given ecosystem's condition is improving or deteriorating over time is necessary both to price a transaction accurately at the point it is made, and to adjust that pricing as circumstances change over the life of the relationship. This requires an ongoing monitoring capability, one that is reliable enough to be trusted by a lender or investor, and affordable enough to apply repeatedly, rather than a single point-in-time assessment.
A path to pricing it
None of this makes vulnerability or dependency unknowable. Addressing the challenges above means being specific about which ones a pricing methodology resolves directly, and which ones it can only support with a better set of tools.
The length of the chain from ground-level practice to financial outcome is addressed by working at the level of the discount rate rather than requiring a fully specified translation at every step in between. The Landbanking Group's physical risk pricing framework adds vulnerability and dependency to the two components markets already handle with reasonable consistency, hazard and exposure, and expresses the combined risk as an adjustment to the cost of capital: a Nature Risk Premium within the cost of equity, or a Nature Risk Adjustment within credit assessment.[12] This avoids the need to forecast, line by line, how a given change in ecosystem condition moves through to revenue or cost, which is the point in the chain where data gaps are most severe, and instead prices the increased uncertainty and downside risk directly.
Dependency is expressed as a weighting on the biophysical terms, informed by third-party assessments of how strongly a given sector's economic activity relies on specific ecosystem services, and refined through expert judgement pending fuller statistical calibration as more firm-level outcome data becomes available.[13] This does not remove the underlying difficulty of establishing a precise threshold for any one business, but it means dependency does not need to be estimated from first principles for every client.
Vulnerability's local character, the fact that it needs to be measured at different spatial scales depending on the hazard, and the need to track it over time are addressed together, through measurement, reporting, and verification built around the same vulnerability indicators used in the pricing methodology itself. This operates at more than one scale: at the landscape level, using indicators such as the Ecosystem Integrity Index, and at the field level, using more localised, hazard-specific indicators such as water holding capacity. Because the indicators used to price a transaction are the same ones tracked afterward, the same measurement infrastructure can, in principle, support both an initial assessment and ongoing monitoring of whether vulnerability is improving or deteriorating.
The difficulty of obtaining precise asset location data is not resolved by a pricing methodology on its own and can instead be managed through complementary approaches. Where exact location is unavailable, instead of requiring one confirmed coordinate, the assessment can work with the set of plausible sites a business could occupy, for example, several candidate locations within a disclosed postcode or landholding, each weighted by how likely it is to be the real one, based on whatever partial information is available. The resulting vulnerability estimate reflects that weighted range of possibilities, rather than resting on a single location. Separately, lenders are increasingly requiring more specific location data from clients directly, for owned and leased assets and for the collateral pledged against a loan, which over time should reduce how often this constraint binds.
The mismatch between the time it takes a resilience intervention to reduce vulnerability and the length of a typical financing relationship is not something a pricing methodology resolves on its own either. What the methodology can offer is a defined trajectory, showing how vulnerability is expected to change over time given a specific set of actions, which gives a lender or investor a basis for structuring a relationship around that trajectory, for example through staged pricing or terms reviewed at defined intervals, rather than resolving the mismatch itself.
Not every challenge identified above is fully resolved by this approach today. Structuring financial relationships around slow-moving resilience gains, and capturing how multiple hazards interact within a single portfolio, remain areas of active work rather than closed problems. The intention, however, is for the same trajectory to apply across all of them: as measurement and monitoring improve, each should move from something priced explicitly and provisionally, to something markets handle as a matter of course.
This approach is most immediately useful, and is already being applied, in the places where the underlying risk is most concentrated: project finance, long-duration infrastructure, and land-backed lending, where an asset's performance over its life is tied closely to the condition of the land beneath it, and where the financial consequences of mispricing that connection play out over years rather than quarters.[14]
That is the practical question this raises for any business or investor whose returns depend, directly or indirectly, on the condition of an ecosystem: whether that dependency is priced in advance, deliberately and at a level that reflects the actual state of the land involved, or left unpriced until it surfaces as a loss, an insurance withdrawal, or a stranded asset. The French farms that lost 8% of their yield instead of 22% did not avoid the drought. They faced a materially smaller version of it, for reasons that current pricing practice does not yet recognise.
[1] Soil Capital, in partnership with KU Leuven, drought resilience study covering 1,262 farms and over 330,000 hectares in France, 2021–2024, as reported in: 'Regenerative farms lost three times less yield in France's droughts. Here's why', Euronews, 4 June 2026.
[2] IPCC, Working Group II, Sixth Assessment Report (2022): vulnerability is defined as 'the propensity or predisposition to be adversely affected', encompassing sensitivity and adaptive capacity, within the risk framework in which risk is a function of hazard, exposure and vulnerability (following IPCC SREX, 2012, and AR5, 2014).
[3] The Landbanking Group, Climate- and Nature-Related Physical Risk Pricing (April 2026), Section 1.2.
[4] Bloomberg Professional Services, 'Does physical climate risk carry a financing premium?', and 'Ten data insights showing the continued rise of climate risk and what investors should look out for in 2026'. Sector and regional figures per Niall Smith, Bloomberg, as reported in IPE, 'Physical climate risks are being priced into cost of capital, finds analysis', 21 October 2025.
[5] A. Garel, A. Romec, Z. Sautner and A. Wagner, 'Firm-level nature dependence', Review of Finance, 30(1), 231–272 (2026). Sample: 31,772 listed firms in 117 countries, 2010–2023.
[6] State Farm General Insurance Company, 'Update on California' (March 2024); 'California Hit by Fresh Home Insurance Blow', Newsweek, 26 March 2024.
[7] F. H. Knight, Risk, Uncertainty, and Profit (1921).
[8] Network for Greening the Financial System (NGFS), cited in IPE, 'Physical climate risks are being priced into cost of capital, finds analysis', 21 October 2025: financial institutions lack sufficient information on companies' asset-level exposures, with a particular gap in visibility on insurance coverage.
[9] A. AghaKouchak et al. (2020) documented the increased likelihood of concurrent drought and heatwave events, drawing on the 2014 California drought, as reviewed in 'Financial climate risk: a review of recent advances and key challenges' (2024).
[10] Munich Re, 'How climate hazards compound across portfolios', Re/Brief (2025), citing Munich Re NatCatSERVICE data.
[11] 'Advances in complex climate change risk assessment for adaptation', npj Climate Action (2025).
[12] The Landbanking Group, Climate- and Nature-Related Physical Risk Pricing (April 2026), Sections 2.3–2.5 and 3–4.
[13] The Landbanking Group, Climate- and Nature-Related Physical Risk Pricing (April 2026), Section 3.2.
[14] The Landbanking Group, Climate- and Nature-Related Physical Risk Pricing (April 2026), Section 2.5.